 GeoData.NZ
SNOW DEPTH
Type of resources
Available actions
Topics
Keywords
Contact for the resource
Provided by
Years
Update frequencies
status
-
Sea ice temperature (°C) measured across multiple depths at (LATITUDE: -77.792300, LONGITUDE: 166.514900). RELATED PUBLICATION: https://doi.org/10.1017/jog.2022.108 GET DATA: https://doi.org/10.1594/PANGAEA.880164
-
Sea ice temperature (°C) measured across multiple depths at (LATITUDE: -77.794900, LONGITUDE: 166.334700). RELATED PUBLICATION: https://doi.org/10.1017/jog.2022.108 GET DATA: https://doi.org/10.1594/PANGAEA.880165
-
Sea ice temperature (°C) measured across 11 depths (57 cm, 78.5 cm, 84.5 cm, 87.5 cm, 96.5 cm, 105.5 cm, 108.5 cm, 114.5 cm, 117.5 cm, 120.5 cm, 129.5 cm) at (LATITUDE: -77.781700, LONGITUDE: 166.315300): RELATED PUBLICATION: https://doi.org/10.1017/jog.2022.108
-
Sea ice temperature (°C) measured across multiple depths from 20 cm to 207.5 cm at (latitude: -77.775800, longitude: 166.312800): RELATED PUBLICATION: https://doi.org/10.1017/jog.2022.108
-
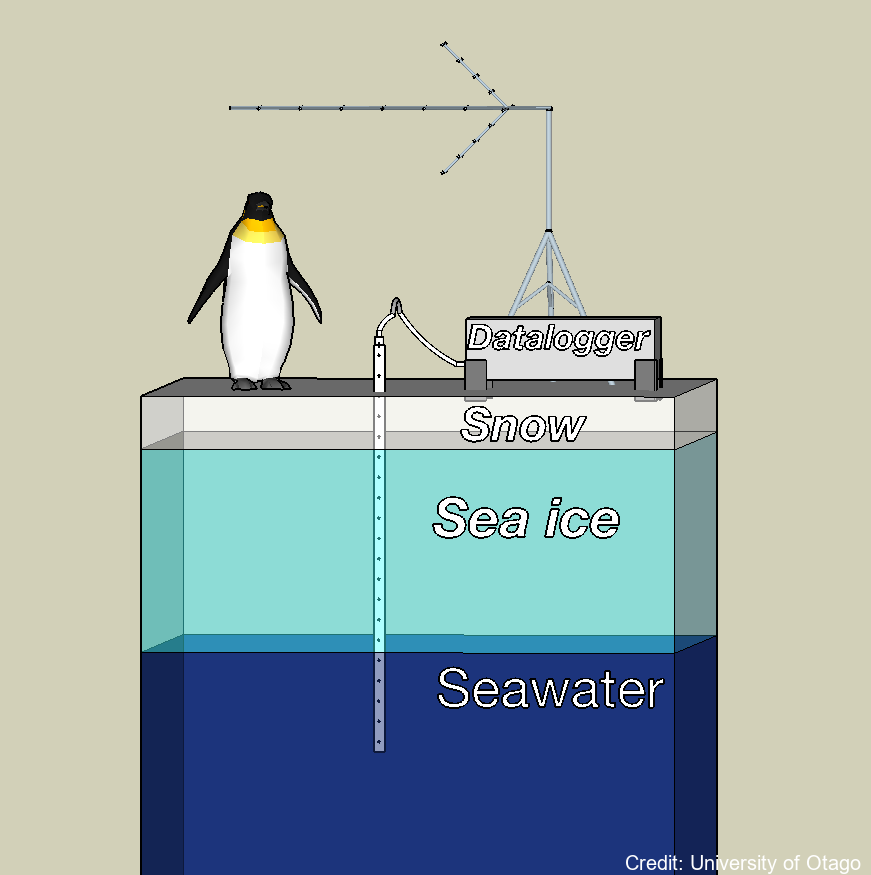
A semi-autonomous sea ice monitoring station (SIMS) was deployed to record ice temperature profiles and snow depths throughout the winter to late spring portion of the sea ice cover's growth season. These data were used to quantify the factors that govern the rate at which the sea ice grows. These factors include the local air temperature, vertical temperature gradient in the sea ice, the thickness of the overlying snow cover and the properties of the water column at the ice / water interface. The ice temperature profiles were recorded by a custom-built temperature probe designed by the University of Otago. The Otago thermistor probe consisted of twenty thermistors contained within a ~ 2.5 m long, 10 mm diameter stainless steel tube. The spacing of the thermistors in the probe was variable. This dataset provides information on the growth of the landfast sea ice and how much of this growth was due to heat loss to the atmosphere vs heat loss to the ocean. Locations: lat:-75.275700, lon:164.067300 (2022/23) Sea ice salinity and fabric cores were collected to understand sea ice growth rates, and indicate the different types of landfast sea ice (e.g. columnar versus incorporated platelet) and to determine their relative vertical positions with the sea ice cover. Sea ice, sub ice platelet layer, snow and freeboard measurements were used to validate ice thicknesses determined by analysing the sea ice temperature profiles collected by the SIMS. Snow depths were measured with a Campbell Scientific ultrasonic sensor (SR50). VIEW DATA: https://seaice.otago.ac.nz/ice-temp-graph/contour/
-
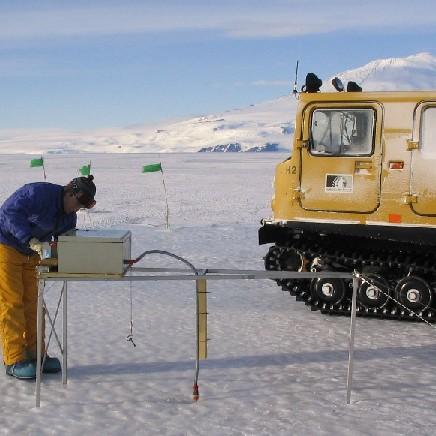
Here, we present drill hole measurements carried out at 14 field sites distributed over a ~1500 km^2 area of fast ice in the south of McMurdo Sound, Antarctica between 1 and 19 November 2018. At each site, five holes were drilled in the fast ice at the centre and end points of two cross‐profile lines, each 30 metre long. Sea ice and SIPL thicknesses were measured with a suspended thickness probe and metal bar using the procedure described in Price et al. (2014). Snow depth measurements at centimetre accuracy were made at half‐metre intervals along the cross‐profiles using a metal ruler or a GPS‐equipped Magnaprobe. Sea ice freeboard (i.e., the height of the sea ice surface above sea level) was measured in each of the drill holes. The average value for each parameter was calculated at each field site to provide a representative measurement over the 30 metre cross-profile fast ice area. The drill hole measurements were used to underpin spatial distribution surveys of the aforementioned parameters, to inform electromagnetic induction forward and inverse models, and to ground-validate satellite altimetry assessments of fast ice freeboard and derived ice thickness in McMurdo Sound.
-
Data provided here have been collected as part of the project "Measurements and Improved Parameterization of the Thermal Conductivity and Heat Flow through First-Year Sea Ice", OPP-0126007* and include measurements of temperature and various ice properties at selected sites in first-year and multiyear sea ice in McMurdo Sound, Antarctica in the years 2002-2004. Data from earlier installations of thermistor chains for measurements of ice temperature carried out by the New Zealand team have also been included. Data files are in Microsoft Excel format, with individual worksheets for specific cores or temperature data sets. Detailed information and comments on data sampling location etc. are provided in the files. Further information on data collection, results etc. can be found in the following publications: Backstrom, L. G. E., and H. Eicken 2007, submitted, Capacitance probe measurements of brine volume and bulk salinity in first-year sea ice, Cold Reg. Sci. Tech. Pringle, D. J., H. Eicken, H. J. Trodahl, and L. G. E. Backstrom 2007, submitted, Thermal conductivity of landfast Antarctic and Arctic sea ice, J. Geophys. Res. Trodahl, H. J., S. O. F. Wilkinson, M. J. McGuinness, and T. G. Haskell 2001, Thermal conductivity of sea ice; dependence on temperature and depth, Geophys. Res. Lett., 28, 1279-1282. Data are in Microsoft Excel format. Abbreviations: AH = Arrival Heights; CH = Camp Haskell (near Delbridge Islands); VUW = Victoria University Wellington; UAF = University Alaska Fairbanks. RELATED PUBLICATION: https://doi.org/10.1017/jog.2022.108 GET DATA: https://drive.google.com/drive/folders/1ooUH9dPvWT66afFC51Cb0JOHg66rn0sy